


Depth Charts are now available on GMX
It's now easier than ever to visualise the deep liquidity available across GMX's more than 60 crypto markets.

GMX announces the introduction of Depth Charts for all its markets, allowing traders to view available liquidity and the exact execution price for any position size easily.
How to use the Depth Charts on GMX
Start by navigating to the GMX trading screen, which can be found by clicking the blue ‘Trade’ button in the dApp or at app.gmx.io/#/trade
Select your market of interest on the trading screen, then switch from the Price tab to the Depth tab by clicking the corresponding icon:
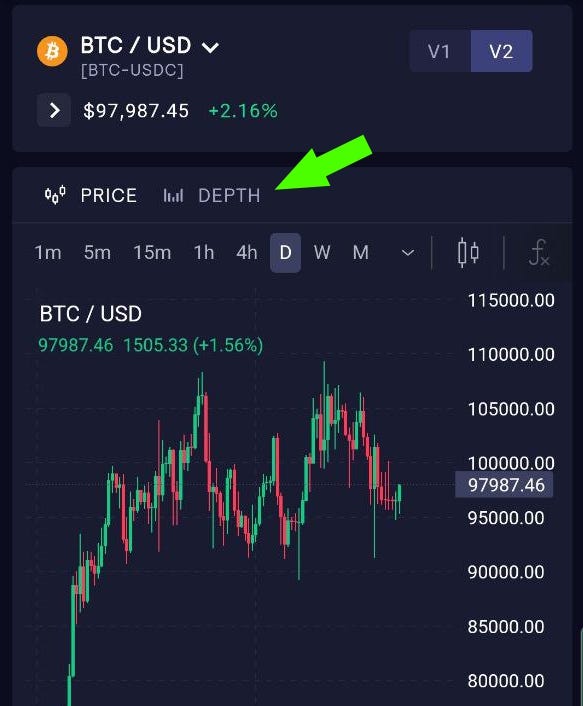
Clicking on the Depth tab will display the newly introduced Depth chart for that specific market and pool. This visualisation of GMX’s virtual order book liquidity provides insight into:
Available liquidity
Execution prices for any position size
The positive or negative price impact for each size
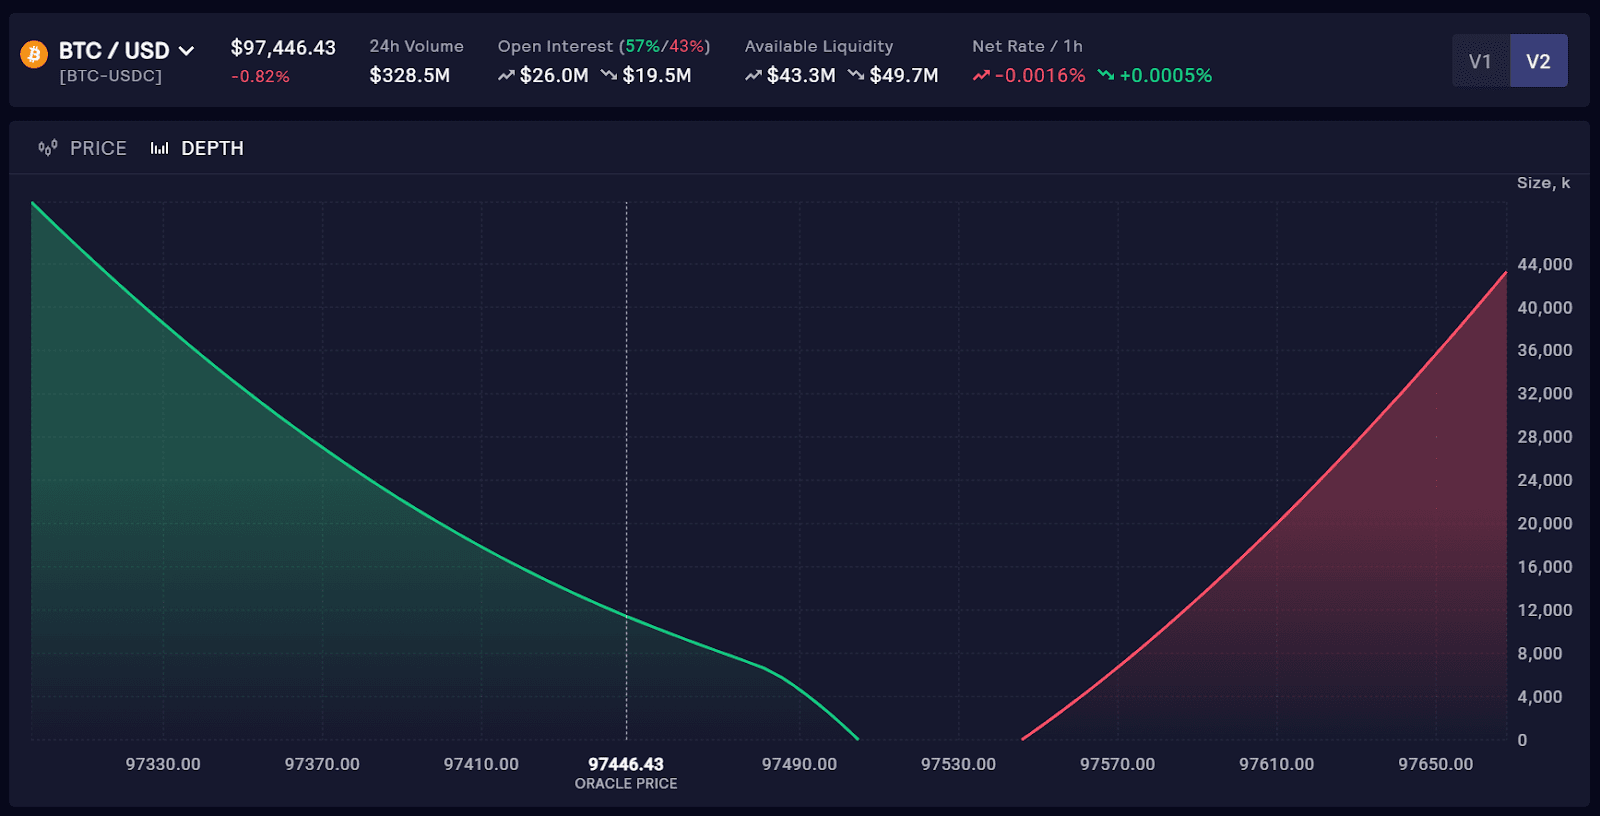
In the example above, you can see the distribution of the $93 million in liquidity available in the BTC-USDC pool at this specific point in time.
The vertical dotted line marks the oracle price (provided by Chainlink Data Streams). The green area displays the execution price for short positions, while the red area shows the execution price for longs.
The green-shaded area to the right of the Oracle price line shows that, because Open Interest on this liquidity pool is currently skewed Long, new Shorts up to about $11 million in size will benefit from positive price impact.
Users can use this information to make more informed trades, realise better entries, and take advantage of positive price impact opportunities on GMX.
Join the GMX community:
Website: https://gmx.io/
Twitter: https://twitter.com/GMX_IO
Telegram: https://t.me/GMX_IO
Announcements: https://t.me/GMX_Announcements
Discord: https://discord.gg/H5PeQru3Aa
Github: https://github.com/gmx-io
Documentation: https://docs.gmx.io/